by Bill McBride on 2/07/2013 10:39:00 AM
This is a quarterly index from the the National Association of Home Builders (NAHB) and is similar to the overall housing market index (HMI). The NAHB started this index in Q4 2008, so all readings are very low.
From the NAHB: Builder Confidence in the 55+ Housing Market Ends Year on a Positive Note
Builder confidence in the 55+ housing market for single-family homes showed continued improvement in the fourth quarter of 2012 compared to the same period a year ago, according to the National Association of Home Builders? (NAHB) latest 55+ Housing Market Index (HMI) released today. The index increased 10 points to a level of 28, the fifth consecutive quarter of year over year improvements.
...
Although all components of the 55+ single-family HMI remain below 50, they have improved significantly from a year ago: present sales climbed 10 points to 27, expected sales for the next six months increased 12 points to 38 and traffic of prospective buyers rose nine points to 24.
...
?Like the overall housing market, the 55+ segment of the market is undergoing a slow but steady recovery,? said NAHB Chief Economist David Crowe. ?That said, there are serious obstacles to a continued and stronger recovery. While problems with tight credit conditions for buyers and obtaining accurate appraisals are still lingering, new problems like spot shortages and rising costs for labor, materials and lots are beginning to emerge.?
 Click on graph for larger image.
This graph shows the NAHB 55+ HMI through Q4 2012. All of the readings are very low for this index, and the index dipped in Q4 - but the general trend is up. Still, any reading below 50 "indicates that more builders view conditions as poor than good."
This is going to be a key demographic for household formation over the next couple of decades, but only if the baby boomers can sell their current homes!
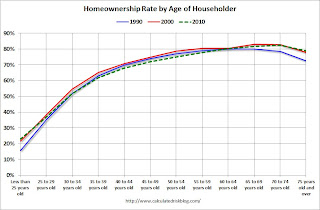
There are two key drivers: 1) there is a large cohort moving into the 55+ group, and 2) the homeownership rate typically increases for people in the 55 to 70 year old age group.
 The second graph shows the homeownership rate by age for 1990, 2000, and 2010. This shows that the homeownership rate usually increases until 70 years old or so.
So demographics?should be favorable for the 55+ market.
Source: http://www.calculatedriskblog.com/2013/02/nahb-builder-confidence-in-55-housing.html
whitney cummings maine caucus whitney houston has died blue ivy carter whitney houston death the vow the voice season 2
No comments:
Post a Comment